Center for Adventist Research | Photograph Database | Prophetic Charts | b18436274_e0001
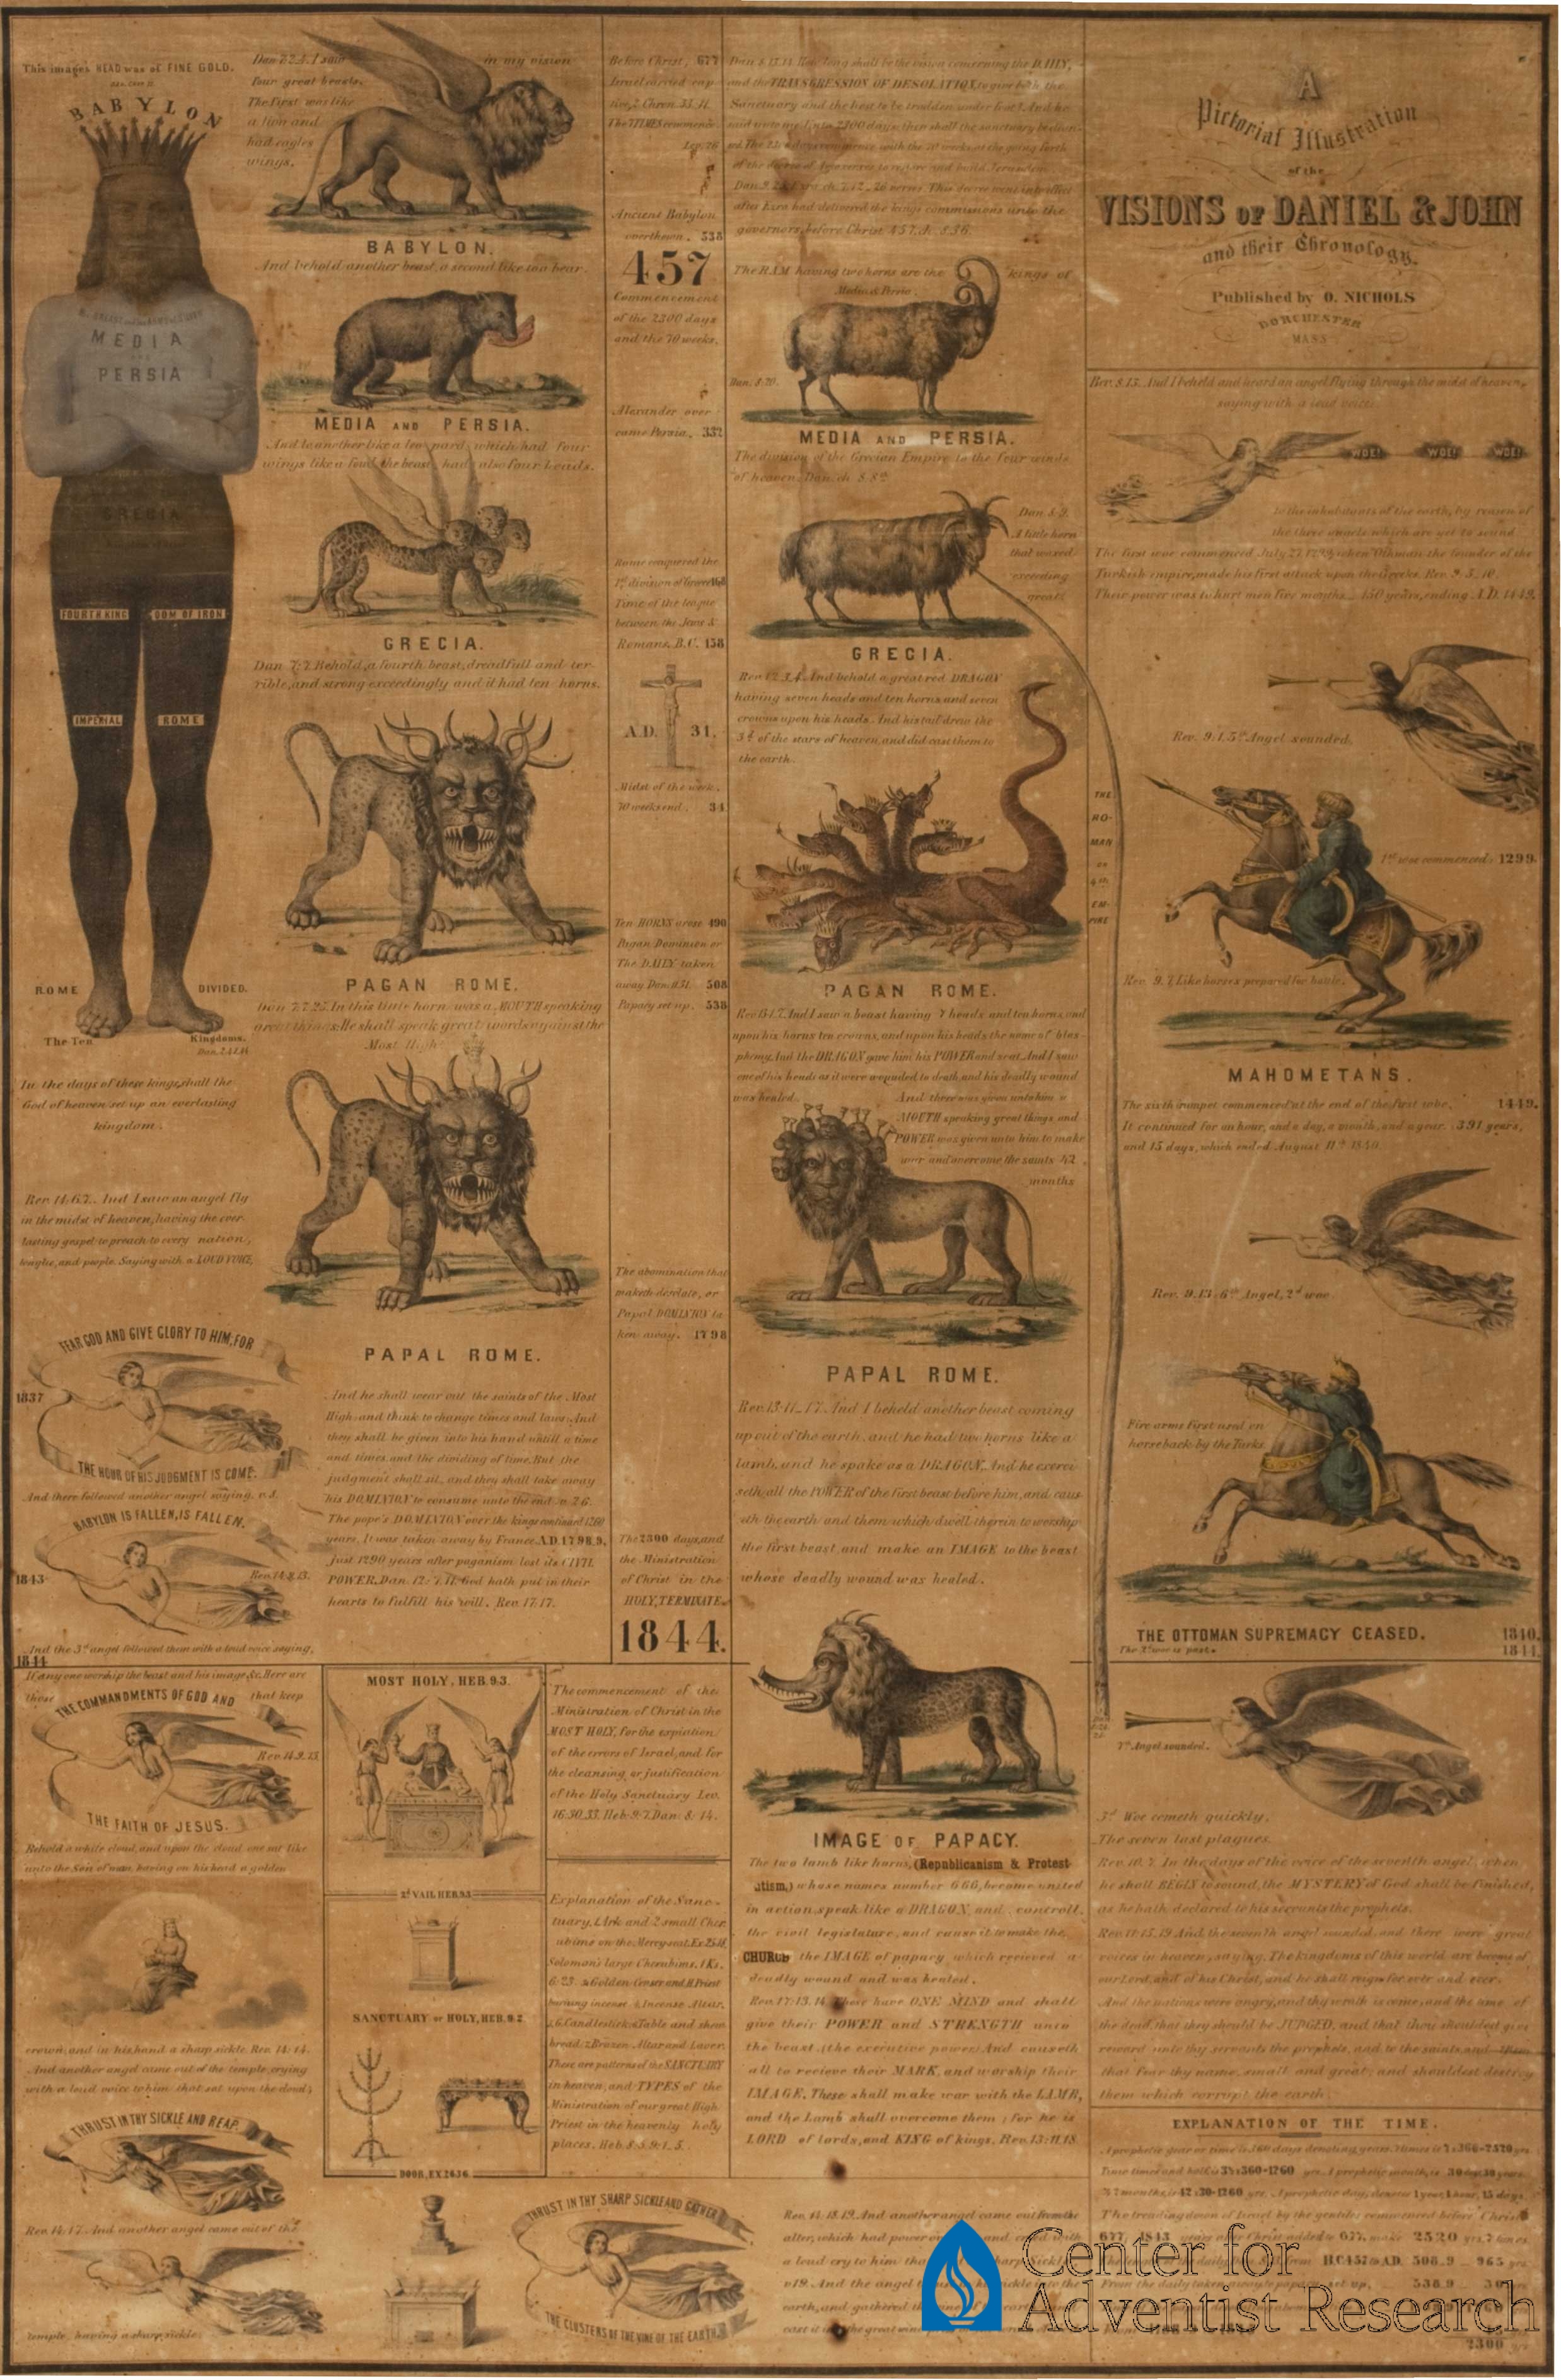
Image Information:
| Title: | A pictorial illustration of the visions of Daniel and John and their chronology |
| Description: | This is the first chart produced by the group of people who would eventually become Seventh-day Adventists. The chart was published by Otis Nichols in 1850. |
| Created: | [1850] |
| Artist: | Nichols, O. |
| City: | Dorchester |
| State: | MA |
| Country: | USA |
| Physical Desc: | 1 chart : illus. ; 74 x 112 cm |
| Physical Reference: | Vault Chart 0014 |
| Digitized: | 01 February 2012 |
Citation: Nichols, O. [1850]. A pictorial illustration of the visions of Daniel and John and their chronology. Database on-line. Center for Adventist Research Image Database. http://centerforadventistresearch.org/photos (accessed Apr 27, 2024).